Ed Lambert recently showed this graph at Angry Bear:
 |
| Graph #1: Ed Lambert's Graph Goes Back to the Late 1960s |
I still don't have a "feel" for what this graph shows. But I notice that the calculation uses Capacity Utilization. I can use the version of Cap-Ut that goes back to 1948 to show more years for Lambert's graph. It won't be exactly the same, because I'll be using Cap-Ut for manufacturing, not for Total Industry. But it'll be close:
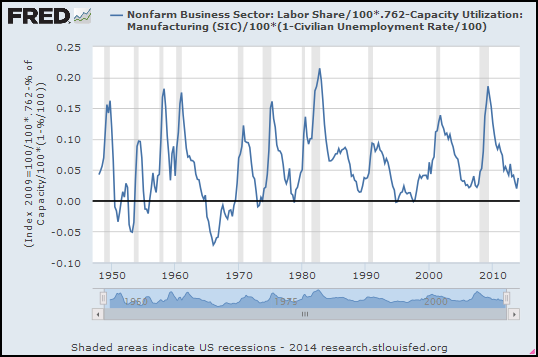 |
| Graph #2: Same Calculation, Different "Capacity Utilization", Earlier Start Date |
At Angry Bear, Lambert writes:
The UT index wants to stay above 0%. Firms (in the aggregate) do not increase profits when slack goes negative, because firms will pay the increased cost of employing more labor and capital, instead of consumers paying that cost.
As I said, I don't have a "feel" for this calculation. But the graph that goes back to 1948 shows Lambert's UT index going below 0% -- a little bit in the 1950s, and more in the 1960s. The absolute lowest low on the graph occurs in the first quarter of 1966.
According to Steve Keen, Minsky said 1966 was the end of the "golden age" economy. Lambert says things are better for consumers when the line is low like that.
Those things fit together.

1 comment:
Hello Arthurian,
This is a reply that I made at the post about the 60's.
Back in the 60′s there was a mindset to push unemployment down low. They inadvertently pushed beyond the natural level. This eventually contributed to problems of inflation that Volcker set out to control.
Now that we have inflation well under control, the UT index has not gone negative like that since.
The UT index would go negative depending on how willing policy is to push the economy past its natural level and risk inflation."
But I would add a thought to this...
Nowadays firms have incredible technology to monitor their costs and profits day by day. They know when they are pushing past the profit maximization point.
Back in the 50's and 60's, bookkeeping was done by paper and it may have taken a couple months to know where your profits are. So there was more lag back then and it could have been easier to slip by the natural level of the economy (which is represented by the 0% on y-axis in the graphs above.
The implication is that the UT index would tend to be more precise nowadays.
Post a Comment