A look at components of TCMDO. All data divided by the GDP deflator.
 |
| Graph #1: The Federal Component of TCMDO (Adjusted) |
This is the version of Federal debt that is now about $10 trillion. It is not the $14 trillion debt. That one is shown at the end of the previous post. This graph, like the previous one, shows that the Federal debt was stable, relative to the price level, until the early 1980s.

 |
| Graph #2: The Non-Federal Component of TCMDO (Adjusted) |
The Non-Federal component of total debt increased gradually but persistently, until the early 1980s. So we can see that, until the 1980s, inflation-adjusted private debt was growing faster than prices, and inflation-adjusted Federal debt was not.
After 1982, the growth of Non-Federal debt increased.
 |
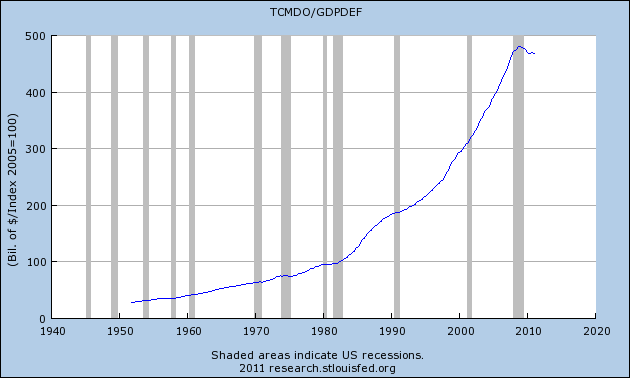
| Graph #3: TCMDO (Adjusted) |
The graph of inflation-adjusted Total Credit Market Debt Owed looks very much like the Non-Federal component shown in Graph #2. The same trends are visible. This is because the Non-Federal debt is such a large part, and the Federal debt such a small part, of all debt.
Couple days back I said more stimulus is not the answer. The next graph shows why.
The growth of Federal debt since 1981 was all stimulus. It was an attempt to improve economic performance. Economic performance was feeble because of the excessive cost created by private-sector debt, which had been accumulating since the end of the Second World War.
But once the Federal debt started expanding, private-sector debt growth accelerated. So the cost of accumulated private debt increased even faster.
The only thing stimulated by government debt is the growth of private-sector debt.
 |
| Graph #4: TCMDO and its Federal and Non-Federal Components (Adjusted) |
Graph #4 is a summary that combines the first three graphs of this post. You can see that total debt (green) and the Non-Federal portion (red) run very close together, and increase consistently from the earliest data. The blue line (Federal debt)
does not increase until the 1980s. And even when it does increase, that increase is nothing compared to the Non-Federal debt.
Once again, these graphs show inflation-adjusted debt numbers.


1 comment:
"The growth of Federal debt since 1981 was all stimulus." -- and that whole paragraph: YES, and I am still saying the same; see my quote at the top of EconCrit:
"Expansion of Federal debt leads to expansion of private-sector debt, but private-sector debt is already so big and costly that it undermines the effectiveness of the "boost" provided by big new public spending. This problem cannot be solved by additional government spending. It can only be solved by reducing private-sector debt."
... from https://econcrit.blogspot.com/2019/06/we-tried-that-already.html
Note also, however, that these graphs all use the incorrect calculation for the inflation adjustment of debt!
Post a Comment